
Statistics
Statistics
Mean - sum of vals / number of vals
Median - middle val of range of vals
Mode - most freq occurring val
If data has perfect Gaussian distribution:
mean = median = mode
If data is skewed positively:
mean > median > mode
Accuracy - assessed by measuring an analyte in reference material and comparing the result c the known certified concentration
Precision - agreement bwt result vals obtained by repeat measurements of a given quantity of analyte
Delta check - compare current result vals to prev vals and flag samples that have exceeded predefined limits for variation
- mean corpuscular red blood cell volume usually has a delta check
- is an example of a patient-derived QC procedure
Sensitivity = TP / (TP+FN)
- tests ability to detect dz
- expressed as number of dz'd pts that test pos
- high sensitivity tests preferred for screening
Specificity = TN / (TN+FP)
- ability of a test to detect truly dz-neg pts
Positive Predictive Value = TP / (TP+FP)
- probability a pt c pos-result actually has the dz
- PPV increases as prevalence inc in population
Negative Predictive Value = TN / (TN+FN)
- probability that someone c neg test result does not have the dz
Likelihood ratio = Sens / (1 - Spec)
- gives the odds of the test result occurring in pt c dz
- gives odds of getting a test result, not a rate
- can be used to determine post-test probability of test
Analytical Measuring Range (AMR)
- aka linear range
- range over which reliable measurements can be obtained
- usually determined by serially diluting samples of concentration and plotting the results
Clinical Reportable Range (CRR)
- refers to the highest and lowest vals that can be reported accurately
- range of quantitative results that can be reported, taking into account the ability to dilute sample that fall ouside the upper limit of the AMR may be applicable
- the low end of the AMR is typically identical to the low end of the CRR
- the upper end of the CRR can be the same or higher than the highest limit of the AMR, depending on the feasibility of sample dilution
Implementation of New Methods
When introducing new methods or instruments into the clin lab, process of eval must be done
Validation reqd for tests that do not have FDA approval
- validation has all the elements of verification, plus sens, spec, and PPV
- reqd when implementing a lab-developed test or modifying an FDA approved test
- important to have written validation plan that is approved by the medical director; usually good to have a validation plan checklist
Verification for FDA approved tests, and is the process by which the lab:
1) verifies that it can reproduce manufacturer claims for precision, accuracy and reportable range
2) verifies reference intervals
3) est parameters for calibration and quality control
- if >1 lab instrument is implemented, correlation bwt them should be demonstrated
Percent Carryover = [ (C - O) / O ] X 100
- where C = Results from potentially contaminated sample; and O = Original results from the uncontaminated sample
- carryover is the transfer of a quantity of an analyte from 1 rxn to the next, and can alter the vals of pt results
- should be assessed when validating a new test system
- can be a problem in tests c wide reference range (like B-hCG)
Pretest probability affects the performance of a test, and one of the most powerful estimates of pretest probability is the prevalence of dz
- when dz prevalence is low, PPV declines and NPV increases
- sens and spec are not influenced by changing prevalence
Pretest odds (dz prevalence) x likelihood ratio = post-test odds
Post-test probability = Post-test odds / (1+ post-test odds)
Coefficient of Variation (CV) = SD / mean x 100
- precision, or reproducability of a test, expressed using the CV
- - the CV can vary over the analytical range of an assay, and thus should be determined at low, mid and high range values
- "within-run" or "intra-assay" CV is made by repeating the test using the same sample in the same day, usually during the same run
-- the within-run precision is usually a function of analyte conc; low concs usually have least precision
- "between-run" or "inter-assay" CV made by repeating the same test using the same sample on different days
- typically the "within-run" is smaller than "between-run"
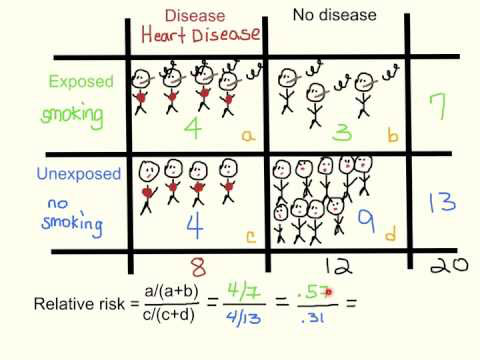
Relative risk
Ratio of the risk in the presence of a risk factor to the baseline risk
ROC curve - area onder the ROC curve measures test's overall ability to discriminate bwt dz and non-dz
- val of 1 is perfect test, 0.5 is no ability to discriminate
- generally a value >0.8 has good discriminatory power
- can compare 2 tests using their areas under the ROC curve
Standard Deviation (SD)
reflexion of variation (how wide the curve is)
- is avg of an ind val from the mean
SD = sqrt(sum(x-mean)^2 / (n-1) )
- 1 SD = 68.2% ; 2 SD = 95.5%; 3 SD = 99.7%
Standard Deviation Index (SDI) = (lab result - peer mean group) / peer group standard deviation
- SDI of +/- 2.0 sometimes used as cutoff for unacceptable performance on proficiency test example
Levey-Jennings Chart
Plots QC results around the expected mean value
- acceptable limits for deviation of the QC results are determined by the lab, which is done through the use of Westgard rules
- x-axis is the "Run #"
- y-axis is the "Concentration"
- the results from runs that are "out of control" should not be reported
-- for out of control tests, first check the reagents and instrument, then repeat the test on a new aliquot of QC reagent (a repeat val that is similar to the old one suggests that a bias does exist)
- if repeat testing not within acceptable limits, a thorough check of the instrument and reagents must be undertaken; once the suspected probs are corrected, the QC reagents are retested to ensure resolution, and finally pt samples must be retested; then must repeat calibration and repeat testing on QC reagents
-- persistence of an out of control assay may require formal instrument maintenance
- the type of error points towards the source of error
Westgard rules - developed in 1981; the first number is the number of results, and the subscript is the distance from the mean in SDs
- so 12s is one value 2 SDs from the mean, which is very sensitive, but sets off false alarms
- can combine rules that offer sensitivity and specificity, such as a 13s / 22s rule
- other Westgard rules:
1:3s - 1 val is >3 SD from the mean; detects imprecision
2:2s - 2 consec vals >2SD on the same side of the mean; detects imprecision and systemic bias
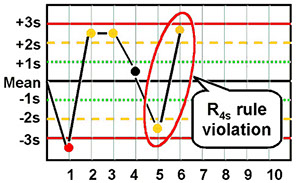
R:4s - 2 vals on the same run found to be >4 SD apart; detects random error
4:1s - 4 consecutive vals >1 SD on the same side of the mean (detects systemic bias)
10:mean - 10 consecutive vals on the same side of the mean; detects systemic bias
Bias trend - having multiple test results come up on one side of the mean (ie 8^1.5s)
- usually means that the analyzer needs to be recalibrated or there is an error in reconstituting QC material
Imprecision = wide scatter of QC results
Limit of Quantification (LoQ)
Validated by testing the accuracy and reproducability at a certain concentration for prespecified limits
- an appropriate LoQ is a value below the lowest, clinically relevant value of the analyte
- per FDA, CV at the LoQ should be less than 15%
- per FDA, accuracy at the LoQ should be >80%
- if no proposed LoQ is given in references or from experience, can determine LoQ from establishing the analyte val for which the signal / noise ratio is more than 10, or by running a matrix blank 20 times and adding 5 SDs to the avg val obtained in the experiment
Variables
Interval scale - gives discrete numbers (ie Na+ vals)
Ordinal scale - gives numbers c assigned vals (ie 1+ to 4+ on urine dipstick protein)
Nominal test - gives a category (positive or negative)

A
B
C
C
B
A
y axis = 1 - specificity, or false + rate
x axis = sens, or true+ rate

S = Standard Deviation

Standard Dev Index
a = lab result; b = peer mean group; MSD = Standard Deviation of the Mean


Cohen's kappa coefficient (κ)
Measures inter-rater agreement for qualitative (categorical) items, and is thought to be more robust than simple percent agreement calculation
- measures agreement bwt 2 raters who classify N iterms into C mutually exclusive categories
Spearman's rank correlation coefficient or Spearman's rho
- is a non-parametric measure of rank correlation (statistical dependence bwt the rankings of 2 variables), and assesses how well the relationship 2 variables can be described using a monotonic function
-
References
1. Cohen's kappa. Wikipedia. https://en.wikipedia.org/wiki/Cohen%27s_kappa